Processing math: 100%

Complex Dynamics -Mandelbrot Set / Julia Set- [gnuplot]

Sunday, October 21, 2018

Fractal gnuplot YouTube

t f B! P L
 

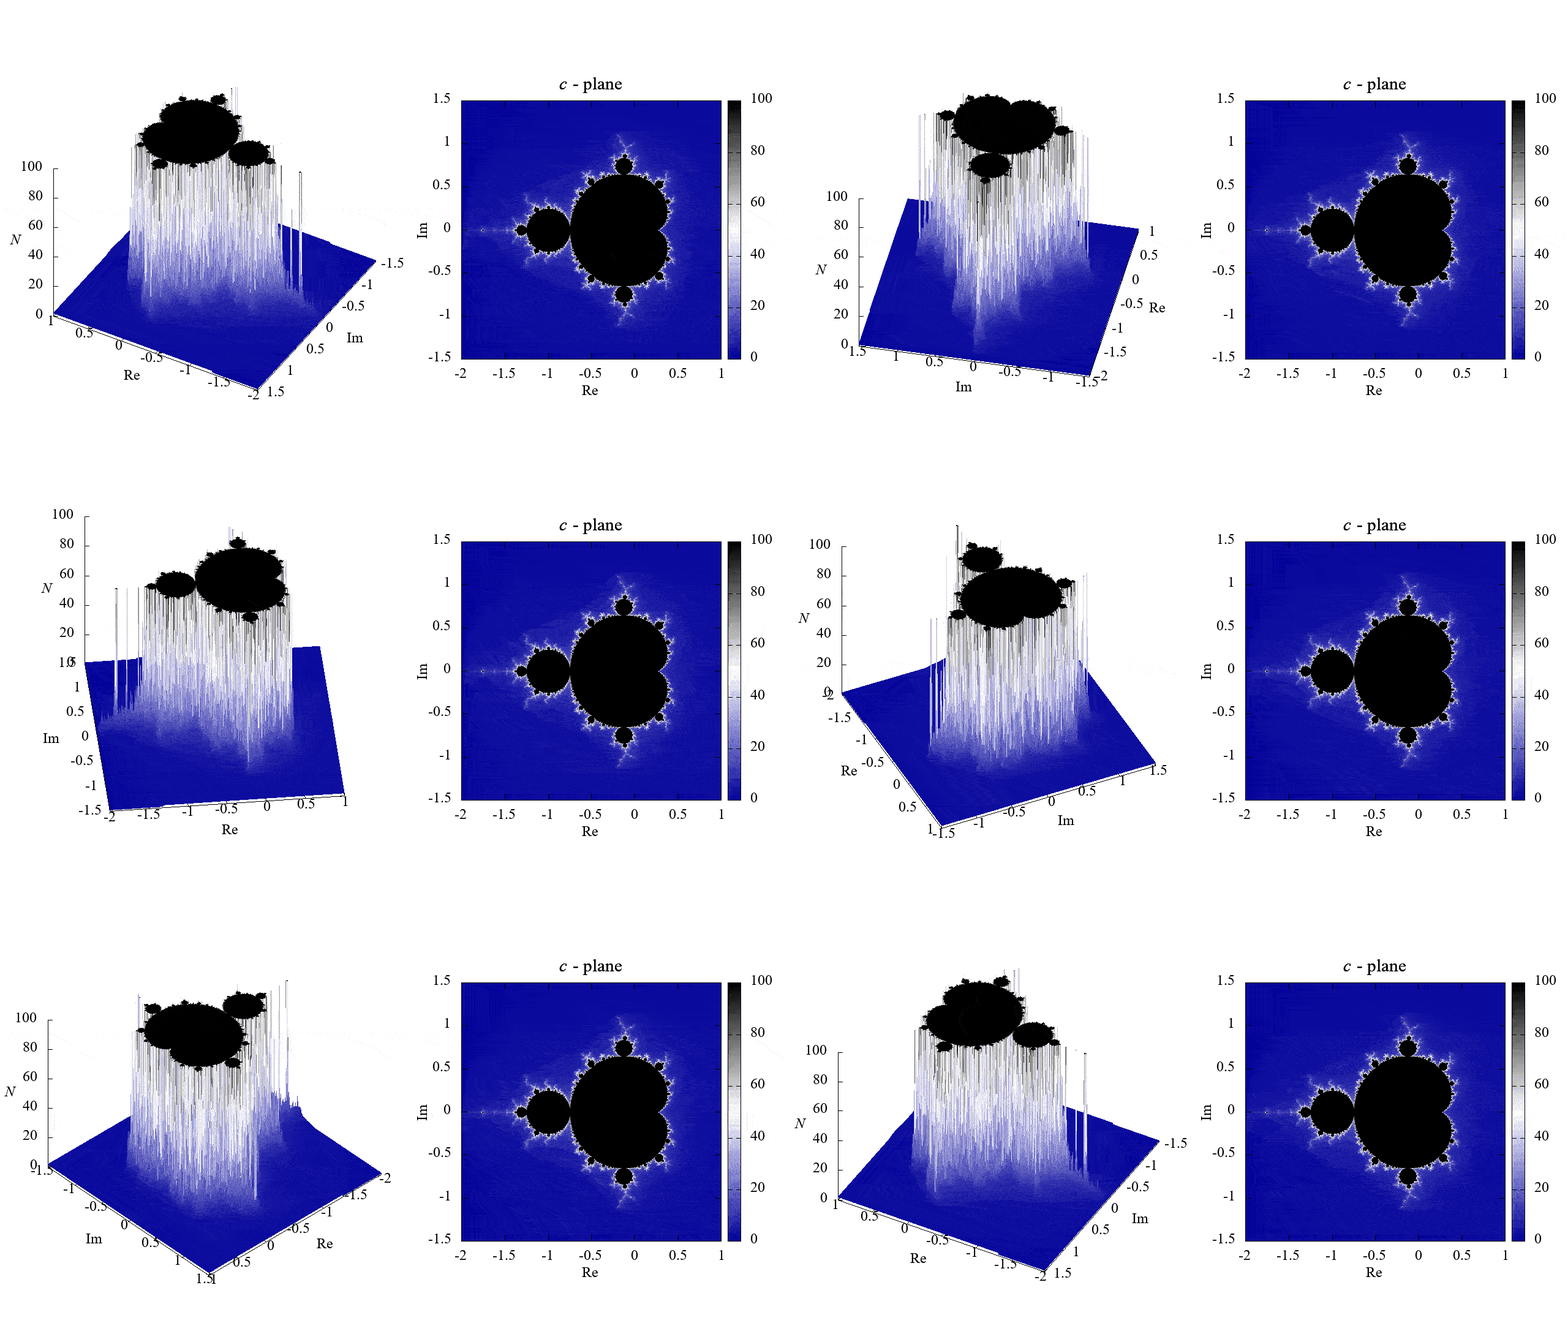
Mandelbrot set

mandelbrot.plt

# Setting --------------------
reset
set term gif animate delay 6 size 1280, 720
set output "mandelbrot.gif"
set margins 0, 0, 0, 0
unset key
unset grid
set ticslevel 0
unset surface
# Palette
set palette defined(0"#000099",1"#ffffff",2"#000000")
# Axes
set xl 'Re' font 'Times New Roman, 18'
set yl 'Im' font 'Times New Roman, 18'
set tics font 'Times New Roman, 18'
set ztics 20
set cbtics 20
# Samples
set samples 700
set isosamples 700, 700
# Function --------------------
compl(a, b) = a*{1, 0}+b*{0, 1}
mand(z, a, n) = (n<=0 || abs(z)>2)? 0: mand(z*z+a, a, n-1) + 1
# Display "c-plane"
set label 1 center "{/TimesNewRoman:Italic c} - plane"\
font 'Times New Roman, 22' at screen 0.755, 0.802
# Plot --------------------
ang = 209 # Initiate angle
N = 100 # Recursion limit (max: 250)
do for[k=1:360]{
set multiplot
# Left side
# Rotate
ang = ang + 360
if(ang>=360){
ang = ang - 360
}
set view 45, ang, 1, 1
set origin 0.01,0.03
set size 0.55, 0.94
set pm3d at s
unset colorbox
set zl 'N' offset 1 font 'Times New Roman:Italic, 18'
splot [-2:1][-1.5:1.5] mand({0, 0}, compl(x, y), N)
# Right side
set pm3d map
set origin 0.55,0.117
set size 0.43, 0.764
set colorbox
unset zl
splot [-2:1][-1.5:1.5] mand({0, 0}, compl(x, y), N)
unset multiplot
}
set out
view raw madelbrot.plt hosted with ❤ by GitHub

mandelbrot.gif


Julia set

julia.plt

# Setting --------------------
reset
set term gif animate delay 6 size 1280, 720
set output "julia.gif"
set margins 0, 0, 0, 0
unset key
unset grid
set ticslevel 0
unset surface
# Palette
set palette rgb 7, 5, 15
# Axes
set xl 'Re' font 'Times New Roman, 18'
set yl 'Im' font 'Times New Roman, 18'
set tics font 'Times New Roman, 18'
set ztics 20
set cbtics 20
# Samples
set samples 700
set isosamples 700, 700
# Function --------------------
complex(x, y)=x*{1, 0}+y*{0, 1}
julia(x, y, z, n) = (abs(z)>2 || n<=0) ? 0 : julia(x, y, z*z+complex(x,y), n-1) + 1
# Select c=a+bi (c: complex constant)
a = -0.790
b = 0.150
# Display "z0-plane"
set label 1 center "{/TimesNewRoman:Italic z_{/TimesNewRoman:Normal 0}} - plane"\
font 'Times New Roman, 22' at screen 0.755, 0.85
# Display c
if(a!=0 && b!=0){
c = sprintf("%.2f%+.2f", a, b)
set label 2 center "({/TimesNewRoman:Italic c} = ".c."{/TimesNewRoman:Italic i})" \
font 'Times New Roman, 20' at screen 0.755, 0.802
}
if(a==0){ # Pure imaginary number
c = sprintf("%.2f", b)
set label 2 center "({/TimesNewRoman:Italic c} = ".c."{/TimesNewRoman:Italic i})" \
font 'Times New Roman, 20' at screen 0.755, 0.802
}
if(b==0){ # Real number
c = sprintf("%.2f", a)
set label 2 center "({/TimesNewRoman:Italic c} = ".c.")" \
font 'Times New Roman, 20' at screen 0.755, 0.802
}
# Plot --------------------
ang = 209 # Initiate angle
N = 100 # Recursion limit (max: 250)
do for[k=1:360]{
set multiplot
# Left side
# Rotate
ang = ang + 1
if(ang>=360){
ang = ang - 360
}
set view 45, ang, 1, 1
set origin 0.01, 0.03
set size 0.55, 0.94
set pm3d at s
unset colorbox
set zl 'N' offset 1 font 'Times New Roman:Italic, 18'
splot [-1.5:1.5][-1.5:1.5] julia(a, b, complex(x, y), N)
# Right side
set pm3d map
set origin 0.55 ,0.117
set size 0.43, 0.764
set colorbox
unset zl
splot [-1.5:1.5][-1.5:1.5] julia(a, b, complex(x, y), N)
unset multiplot
}
set out
view raw julia.plt hosted with ❤ by GitHub

julia.gif


Multiplot Mandelbrot / Julia set

multiplot_man_jul.plt

# Setting --------------------
reset
set term gif animate delay 4 size 1280, 720
set pm3d map at s
set margins 0, 0, 0, 0
unset key
unset grid
set ticslevel 0
unset colorbox
# Palette
set palette defined (0 '#000090',1 '#000fff',2 '#0090ff',\
3 '#0fffee', 4 '#90ff70', 5 '#ffee00',\
6 '#ff7000',7 '#ee0000',8 '#7f0000')
# set palette cubehelix start 1 cycles -5 saturation 3 positive # cube
# set palette defined(0"black", 1"red", 2"white", 3"black") # black
# Axes
set xl 'Re' font 'Times New Roman, 18'
set yl 'Im' font 'Times New Roman, 18'
unset zl
set tics font 'Times New Roman, 18'
set ztics 20
# Samples
set samples 700
set isosamples 700, 700
# Parameter
T = 360 # period [step]
omega = 2*pi/T
# Function --------------------
complex(a,b) = a*{1,0} + b*{0,1}
Mandel(x, y, z, n) = (abs(z)>2 || n<=0) ? 0 : Mandel(x, y, z*z+complex(x,y), n-1) + 1
Julia(x, y, z, n) = (abs(z)>2 || n<=0) ? 0 : Julia(x, y, z*z+complex(x,y), n-1) + 1
# Cardioid
xCardioid(i) = 0.5*cos(omega*i)*(1-cos(omega*i)) + 0.25
yCardioid(i) = 0.5*sin(omega*i)*(1-cos(omega*i))
# Circle
r = 0.7211
xCircle(i) = r*cos(omega*i)
yCircle(i) = r*sin(omega*i)
# Plot --------------------
path = "cardioid" # Select "cardioid" or "circle"
filename = sprintf("multiplot_path=%s.gif", path)
set output filename
N = 100 # Recursion limit (max: 250)
do for[i=0:T-1]{
# Calculate position of c # ex.) path = "Cardioid"
eval "a = x".path."(i)" # a = xCardioid(i)
eval "b = y".path."(i)" # b = yCardioid(i)
set multiplot
# Left side
set origin 0.05, 0.15
set size 0.45, 0.8
set obj 1 circ at a, b, 100 front size 0.03 fc rgb "orange" fs solid noborder # or 'light-green'
splot [-2:1][-1.5:1.5][0:100] Mandel(x, y, complex(0, 0), N)
# Right side
set origin 0.53, 0.15
set size 0.45, 0.8
unset obj 1
splot [-1.5:1.5][-1.5:1.5][0:100] Julia(a, b, complex(x,y), N)
unset multiplot
}
set out

multiplot_path=cardioid.gif


Other examples of palette

set palette cubehelix start 1 cycles -5 saturation 3 positive  # cube  (YouTube 2:20)
set palette defined(0"black", 1"red", 2"white", 3"black")         # black (YouTube 4:28)

multiplot_path=circle.gif

[13th line] palette: black
[66th line] obj 1 : light-green

Search This Blog

Translate

QooQ