YouTube
Simulation [gnuplot]
Case 1 : $\sqrt{2}$
Make DAT file [C]
Get "r2_1M.dat" (line:21) → The Square Root of Two to 1 Million Digits (APOD)▼ RW-r2.c
#include <stdio.h>
#include <math.h>
#include <string.h>
#include <stdlib.h>
#define LIMIT 1000000  // Digits
#define LENGTH 80      // The number of characters per line
#define NUM0 4         // Number of leading zeros
  //  Link(APOD)  :  1.414213562373095048...
  // -> r2_1M.dat:0000414213562373095048...
#define PI 3.1415

int main(void){
    FILE *fp, *fq;
    char str[256];
    double x = 0;    // Position.x
    double y = 0;    // Position.y
    int i, j, k;     // For Loop counter
    int digit;       // Current digit
    int num;         // Number

    fp = fopen("r2_1M.dat", "r");          // Make this file by yourself
    fq = fopen("randomwalk-r2.dat", "w");

    if(fp==NULL){
        printf("File not found. Program terminated.\n");
        exit(1);
    }

    fprintf(fq, "%.3lf\t%.3lf\n",x, y);     // Initiate value

    // i: row, j: column, k: 0 - 9
    for(i=1; fgets(str, sizeof(str), fp)!=NULL; i++){
        for (j=0; j<LENGTH; j++){
            // Calculate current digit
            digit = (LENGTH*(i-1)+j+1) - NUM0;

            // Ignore leading zero NUM0 times
            if(digit<=0) continue;

            // From (NUM0+1)th digit on
            for(k=0; k<10; k++){             // Check matching between k and num
                num = str[j] - '0';

                if(num ==k){                 // Calculate x and y
                    x += cos(2*PI*k/10);
                    y += sin(2*PI*k/10);
                    fprintf(fq, "%.3lf\t%.3lf\t%d\t%7d\n",x, y, k, digit-NUM0);
                    break;
                }
            }
            if(digit==LIMIT) break;
        }
        if(digit==LIMIT) break;

    }
    fclose(fq);
    fclose(fp);
    return 0;
}
→make "randomwalk-r2.dat"Draw $\sqrt{2}$ random walk [gnuplot]
▼ RW-r2.plt# Setting --------------------
reset
set terminal gif animate delay 6 size 1280, 720
set output "randomwalk-pi.gif"
set size ratio 1
set nokey
set xr[-2000:200]
set yr[-600:1600]
set tics font 'Times, 20'
unset xl
unset yl
N = 1000000 # Digits
dec = 200 # Decimation
#system "mkdir png" # Make folder for storing PNG files
DIGIT(i) = sprintf("Digits: %d\n", i) # Label displaying digits
# Plot --------------------
do for[i=0:N]{
# Digits
set label 1 left DIGIT(i) font 'Times, 22' at graph 1.04, 0.03
# Decimate and draw (the number of files: N/200+1)
if(i%dec==0){
# Draw initiate value
if(i==0){
plot 1/0
continue
}
# Update
plot 'randomwalk-r2.dat' every ::0::i-1 using 1:2 with lines lc rgb "red"
}
}
set out
▼ randomwalk-r2.gif (dec=5000)
Case 2 : $\pi$
Make DAT file [C]
Get "pi_1M.dat" (line:23) → 1 Million Digits of Pi (Pi Land by Eve)▼ RW-pi.c
#define LENGTH 50      // The number of characters per line
#define NUM0 0         // Number of leading zeros
  // Link(Pi Land) :141592653589793238462643...
  // ->  pi_1M.dat :141592653589793238462643...
    fp = fopen("pi_1M.dat", "r");
    fq = fopen("randomwalk-pi.dat", "w");
→make "randomwalk-pi.dat"
Draw $\pi$ random walk [gnuplot]
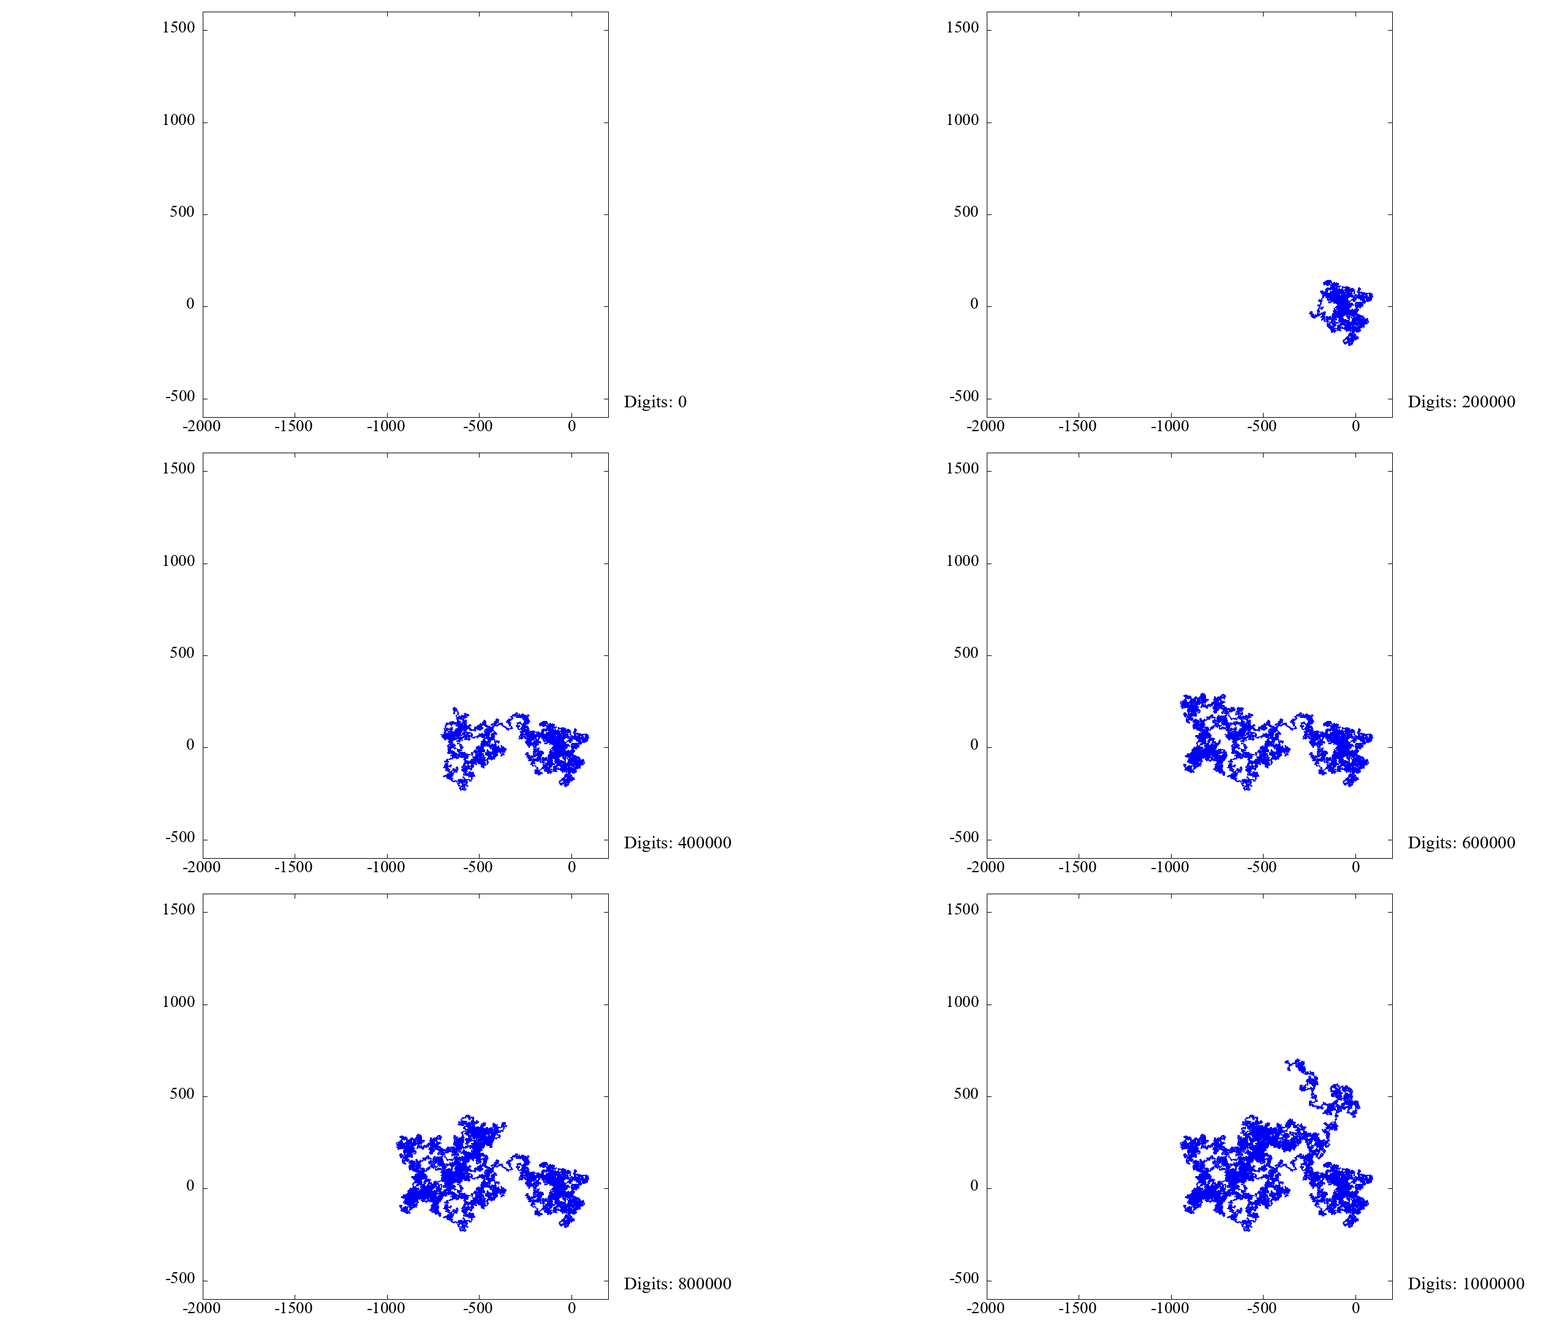
▼ RW-pi.pltplot 'randomwalk-pi.dat' every ::0::i-1 using 1:2 with lines lc rgb "blue"
▼ randomwalk-pi.gif (dec=5000)
Case 3 : $e$
Make DAT file [C]
Get "e_1M.dat" (line:23) → The Number e to 1 Million Digits (APOD)▼ RW-pi.c
#define LENGTH 80      // The number of characters per line
#define NUM0 4         // Number of leading zeros
  //  Link(APOD) :  2.718281828459045235360...
  // -> e_1M.dat :0000718281828459045235360...
    fp = fopen("e_1M.dat", "r");
    fq = fopen("randomwalk-e.dat", "w");
→make "randomwalk-e.dat"
Draw $e$ random walk [gnuplot]
▼ RW-e.pltplot 'randomwalk-e.dat' every ::0::i-1 using 1:2 with lines lc rgb "green"
▼ randomwalk-e.gif (dec=5000)
Extra
Draw random walks of $\sqrt{2}$, $\pi$, and $e$ simultaneouslyRead DAT files created already and plot them
▼ 3RWs.plt# Setting --------------------
reset
set terminal png enhanced font "Times" 20 size 720, 720
set xr[-2000:200]
set yr[-800:1400]
set size ratio 1
set tics font 'Times, 20'
set xtics 400
set ytics 400
unset key
# Axes
set arrow 1 nohead from 0, -800 to 0, 1400 lc rgb "black" lw 2
set arrow 2 nohead from -2000, 0 to 200, 0 lc rgb "black" lw 2
# Digits
N = 1000000
# Arrays
array num[3] = ["r2", "pi", "e"] # Number
array color[3] = ["red", "blue", "green"] # Color
# Functions --------------------
PNG(i) = sprintf("img_%04d.png", i) # Output img_000i.png
DAT(i) = sprintf("randomwalk-%s.dat", num[i]) # num[i] -> name of DAT files
# Plot DAT files --------------------
do for[i=1:3]{
set output PNG(i)
str = "plot " # Command (need space)
# Make the command using string concatenation ("A"."B" -> "AB")
do for [j=1:i] {
if(j!=1){
str = str.", " # Need ", " for plotting DAT files together
}
str = str.sprintf("'%s' every ::0::N with lines lc rgb '%s' lw 0.5", DAT(j), color[j])
}
eval str # Execute this command
# i=1: plot 'randomwalk-r2.dat' every ::0::N with lines lc rgb 'red' lw 0.5
# i=2: plot 'randomwalk-r2.dat' every ::0::N with lines lc rgb 'red' lw 0.5,
# 'randomwalk-pi.dat' every ::0::N with lines lc rgb 'blue' lw 0.5
# i=3: plot 'randomwalk-r2.dat' every ::0::N with lines lc rgb 'red' lw 0.5,
# 'randomwalk-pi.dat' every ::0::N with lines lc rgb 'blue' lw 0.5,
# 'randomwalk-e.dat' every ::0::N with lines lc rgb 'green' lw 0.5
}
set out
Output PNG files
| img_0001.png ($\sqrt{2}$) | img_0002.png ($\sqrt{2}, \pi$) | img_0003.png ($\sqrt{2}, \pi, e$) |


No comments:
Post a Comment